
SUBSCRIBE to the Fact of the Week
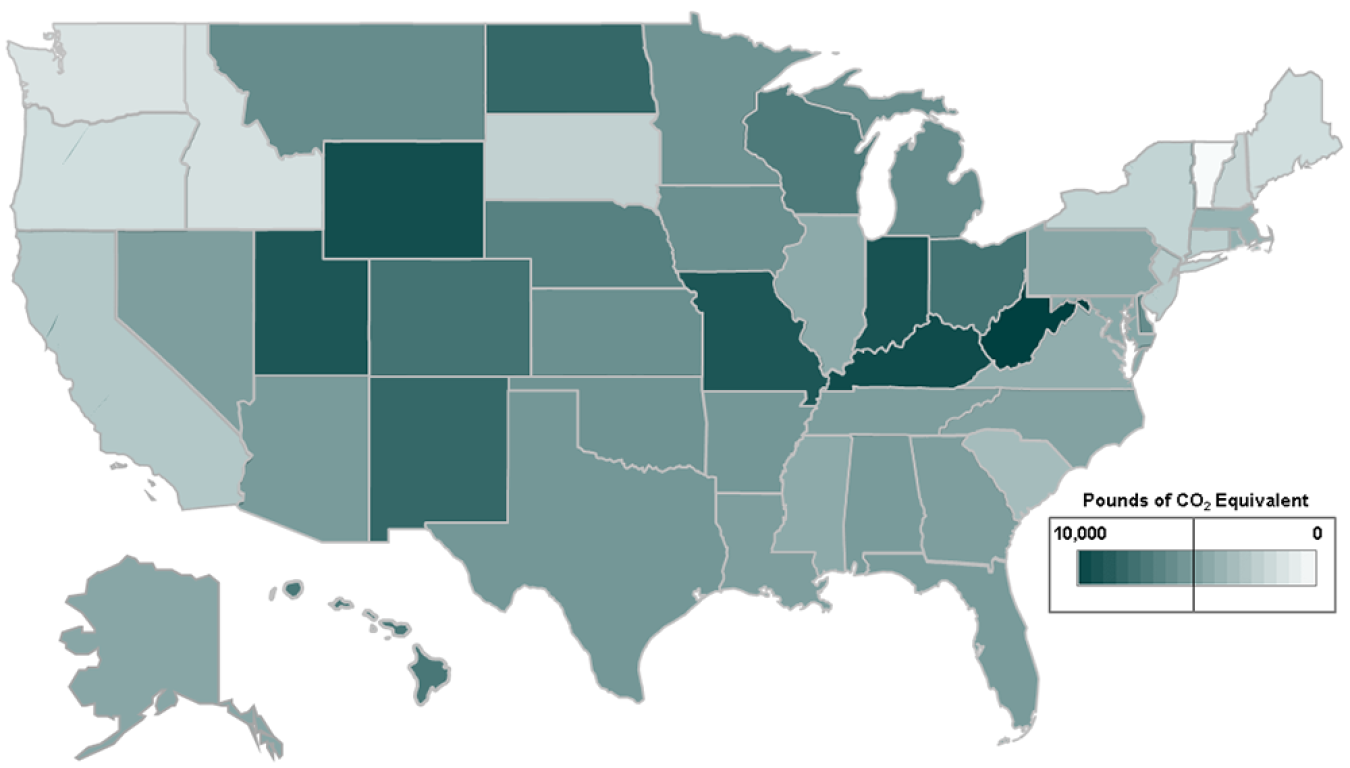
An all-electric vehicle (EV) does not produce emissions from the tailpipe, but there are upstream emissions (also called well-to-wheel emissions) of greenhouse gases from electricity production. Using electricity production data by source and state, the Alternative Fuels Data Center has estimated the annual carbon dioxide (CO2)-equivalent emissions of a typical EV. EVs charging in Vermont are estimated to produce the fewest emissions – oil and gas make up only 1.2% of the electricity sources in the state while cleaner sources such as nuclear, hydro, biomass, wind, and solar make up the rest. West Virginia's electricity production is 95.7% from coal, making it the state with the most well-to-wheel CO2-equivalent emissions. The national average is 4,815 pounds of CO2-equivalent emissions for a typical EV per year as compared to the average gasoline-powered car which produces 11,435 pounds of CO2-equivalent emissions annually.
Annual Well-to-Wheel Emissions from a Typical EV by State, 2015
Supporting Information
| State | Annual Emissions per Vehicle (Pounds of CO2 Equivalent) |
|---|---|
| Vermont | <1 |
| Washington | 987 |
| Idaho | 1,179 |
| Maine | 1,559 |
| Oregon | 1,644 |
| New Hampshire | 1,886 |
| South Dakota | 1,941 |
| New York | 2,112 |
| Connecticut | 2,336 |
| New Jersey | 2,529 |
| California | 2,706 |
| South Carolina | 3,090 |
| Massachusetts | 3,803 |
| Virginia | 3,931 |
| Illinois | 4,003 |
| Rhode Island | 4,122 |
| Mississippi | 4,140 |
| Alaska | 4,182 |
| Pennsylvania | 4,278 |
| Maryland | 4,378 |
| North Carolina | 4,395 |
| District of Columbia | 4,540 |
| Tennessee | 4,563 |
| Louisiana | 4,588 |
| Georgia | 4,643 |
| Nevada | 4,689 |
| Alabama | 4,815 |
| Florida | 4,830 |
| Arizona | 4,845 |
| Arkansas | 5,059 |
| Texas | 5,086 |
| Minnesota | 5,142 |
| Oklahoma | 5,271 |
| Iowa | 5,440 |
| Kansas | 5,444 |
| Michigan | 5,520 |
| Delaware | 5,654 |
| Montana | 5,670 |
| Nebraska | 6,108 |
| Wisconsin | 6,443 |
| Hawaii | 6,696 |
| Colorado | 6,936 |
| Ohio | 6,958 |
| New Mexico | 7,446 |
| North Dakota | 7,470 |
| Missouri | 8,328 |
| Utah | 8,362 |
| Indiana | 8,682 |
| Wyoming | 8,823 |
| Kentucky | 8,965 |
| West Virginia | 9,451 |
| EV National Average | 4,815 |
| For Comparison Purposes: | |
| Gasoline Vehicle Average | 11,435 |
Note: See assumptions for the estimations here. | |