
SUBSCRIBE to the Fact of the Week
Plug-in vehicle sales reached a milestone in September 2016 as cumulative sales topped 500,000 units. The introduction of the first mass market plug-in vehicles occurred in December of 2010 with the introduction of the Chevrolet Volt and Nissan Leaf. By the end of 2012 there were 11 different plug-in models available, and by September of 2016 there were 27 different models. Electric vehicle sales have been accelerating in 2016. For the past three years, sales of plug-in vehicles have averaged a little over 10,000 units per month. However, monthly sales records have been set five times since December 2015, and reached an all-time high of 16,069 units in September of 2016.
Cumulative Plug-in Vehicle Sales, December 2010 – September 2016
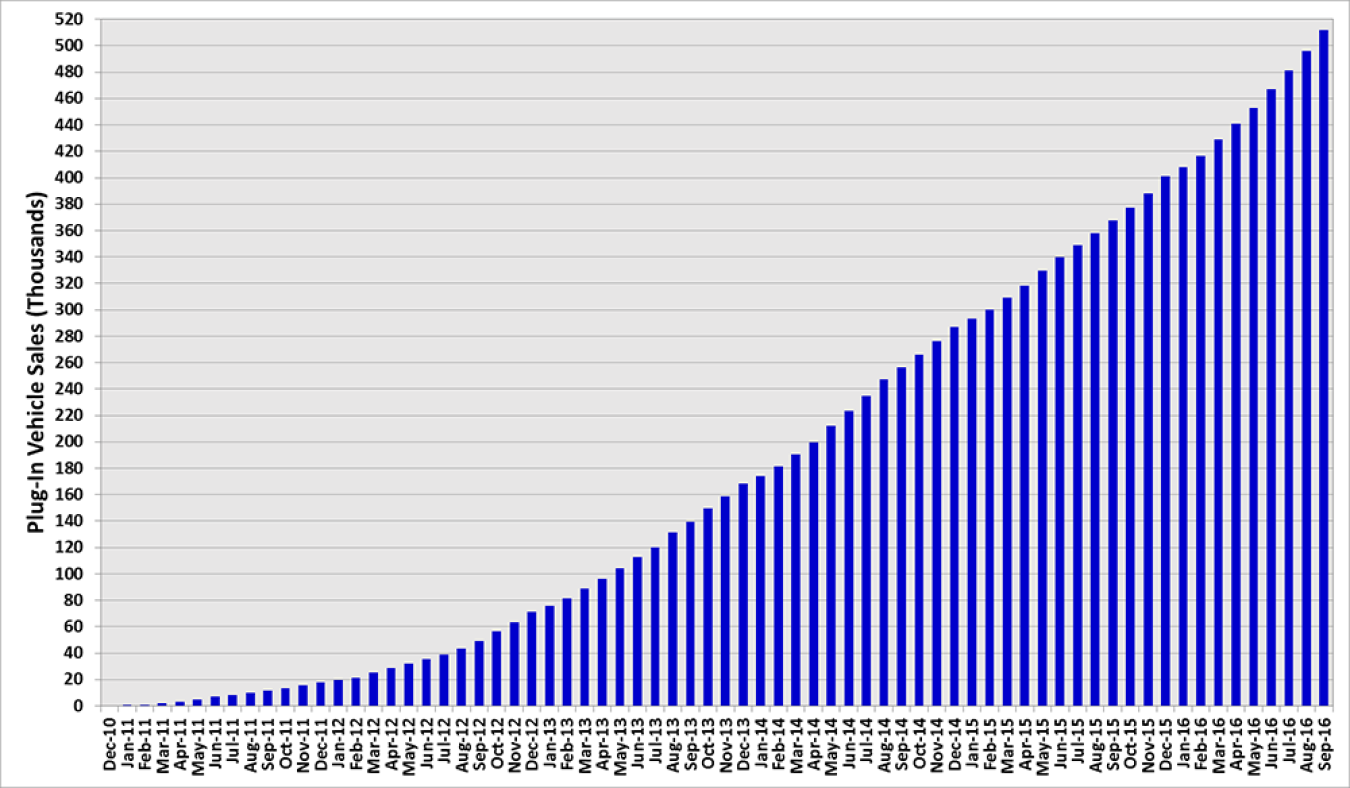
Note: Plug-in vehicles include all-electric vehicles, plug-in hybrid-electric vehicles, and plug-in range-extended vehicles.
Supporting Information
Cumulative PEV Sales by Month, December 2010 – September 2016
| Month-Year | Monthly Sales | Cumulative Sales |
|---|---|---|
| December 2010 | 345 | 345 |
| January 2011 | 424 | 769 |
| February 2011 | 364 | 1,133 |
| March 2011 | 906 | 2,039 |
| April 2011 | 1,066 | 3,105 |
| May 2011 | 1,631 | 4,736 |
| June 2011 | 2,269 | 7,005 |
| July 2011 | 1,057 | 8,062 |
| August 2011 | 1,665 | 9,727 |
| September 2011 | 1,754 | 11,481 |
| October 2011 | 1,974 | 13,455 |
| November 2011 | 1,912 | 15,367 |
| December 2011 | 2,741 | 18,108 |
| January 2012 | 1,427 | 19,535 |
| February 2012 | 1,662 | 21,197 |
| March 2012 | 4,161 | 25,358 |
| April 2012 | 3,595 | 28,953 |
| May 2012 | 3,378 | 32,331 |
| June 2012 | 3,318 | 35,649 |
| July 2012 | 3,016 | 38,665 |
| August 2012 | 4,744 | 43,409 |
| September 2012 | 5,809 | 49,218 |
| October 2012 | 7,232 | 56,450 |
| November 2012 | 7,158 | 63,608 |
| December 2012 | 7,669 | 71,277 |
| January 2013 | 4,726 | 76,003 |
| February 2013 | 5,455 | 81,458 |
| March 2013 | 7,632 | 89,090 |
| April 2013 | 7,138 | 96,228 |
| May 2013 | 7,754 | 103,982 |
| June 2013 | 8,742 | 112,724 |
| July 2013 | 7,442 | 120,166 |
| August 2013 | 11,363 | 131,529 |
| September 2013 | 8,127 | 139,656 |
| October 2013 | 10,100 | 149,756 |
| November 2013 | 8,833 | 158,589 |
| December 2013 | 9,790 | 168,379 |
| January 2014 | 5,905 | 174,284 |
| February 2014 | 7,045 | 181,329 |
| March 2014 | 9,172 | 190,501 |
| April 2014 | 8,905 | 199,406 |
| May 2014 | 12,453 | 211,859 |
| June 2014 | 11,493 | 223,352 |
| July 2014 | 11,433 | 234,785 |
| August 2014 | 12,403 | 247,188 |
| September 2014 | 9,340 | 256,528 |
| October 2014 | 9,662 | 266,190 |
| November 2014 | 9,785 | 275,975 |
| December 2014 | 11,286 | 287,261 |
| January 2015 | 6,090 | 293,351 |
| February 2015 | 7,024 | 300,375 |
| March 2015 | 8,735 | 309,110 |
| April 2015 | 8,999 | 318,109 |
| May 2015 | 11,473 | 329,582 |
| June 2015 | 10,384 | 339,966 |
| July 2015 | 8,979 | 348,945 |
| August 2015 | 9,010 | 357,955 |
| September 2015 | 9,742 | 367,697 |
| October 2015 | 9,821 | 377,518 |
| November 2015 | 10,378 | 387,896 |
| December 2015 | 13,388 | 401,284 |
| January 2016 | 6,713 | 407,997 |
| February 2016 | 8,333 | 416,330 |
| March 2016 | 12,434 | 428,764 |
| April 2016 | 12,108 | 440,872 |
| May 2016 | 12,145 | 453,017 |
| June 2016 | 13,791 | 466,808 |
| July 2016 | 14,287 | 481,095 |
| August 2016 | 14,973 | 496,068 |
| September 2016 | 16,069 | 512,137 |
| Source: Argonne National Laboratory "Light Duty Electric Drive Vehicles Monthly Sales Updates" website, September 2016. | ||