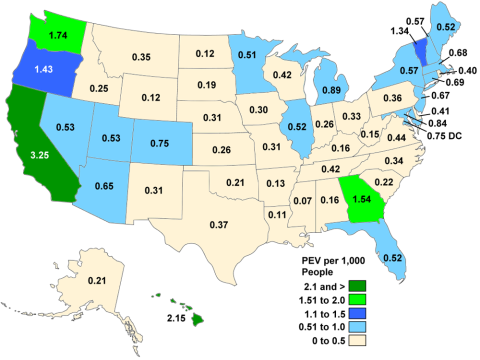
Plug-in electric vehicles (PEVs) include battery electric vehicles (BEVs) and plug-in hybrid electric vehicles (PHEVs). The first mass marketed PEVs were introduced in 2010 with the Nissan Leaf, which is a BEV, and the Chevrolet Volt, which is a PHEV. After four years of sales, California had the most PEV registrations of any state with 3.25 PEVs per thousand people. Hawaii had the second highest concentration of PEVs followed by Washington and Georgia. Georgia is noteworthy because it had the fourth highest concentration of PEVs in a region where neighboring states had significantly fewer PEVs relative to their populations. Georgia’s higher number of PEV registrations is likely a reflection of generous state incentives for the purchase of electric vehicles. Mississippi had the fewest PEV registrations of any state relative to population.
Plug-in Electric Vehicle Registrations per Thousand People by State, 2014
Notes:
PEV – Plug-in electric vehicle (Includes BEV and PHEV).
BEV – Battery electric vehicle (Also referred to as an all-electric vehicle).
PHEV – Plug-in hybrid electric vehicle (Has a gasoline engine as a backup for when the battery is depleted).
PEV registrations include all PEVs under 10,000 lbs. gross vehicle weight registered in the state in July 2014.
Supporting Information
| State | PEV Registrations | Population Estimates | PEV Registrations per Thousand People |
|---|---|---|---|
| Alabama | 773 | 4,849,377 | 0.16 |
| Alaska | 155 | 736,732 | 0.21 |
| Arizona | 4,361 | 6,731,484 | 0.65 |
| Arkansas | 374 | 2,966,369 | 0.13 |
| California | 126,283 | 38,802,500 | 3.25 |
| Colorado | 4,001 | 5,355,866 | 0.75 |
| Connecticut | 2,476 | 3,596,677 | 0.69 |
| Delaware | 383 | 935,614 | 0.41 |
| District of Columbia | 493 | 658,893 | 0.75 |
| Florida | 10,383 | 19,893,297 | 0.52 |
| Georgia | 15,551 | 10,097,343 | 1.54 |
| Hawaii | 3,050 | 1,419,561 | 2.15 |
| Idaho | 409 | 1,634,464 | 0.25 |
| Illinois | 6,694 | 12,880,580 | 0.52 |
| Indiana | 1,697 | 6,596,855 | 0.26 |
| Iowa | 928 | 3,107,126 | 0.30 |
| Kansas | 750 | 2,904,021 | 0.26 |
| Kentucky | 701 | 4,413,457 | 0.16 |
| Louisiana | 527 | 4,649,676 | 0.11 |
| Maine | 695 | 1,330,089 | 0.52 |
| Maryland | 5,028 | 5,976,407 | 0.84 |
| Massachusetts | 4,612 | 6,745,408 | 0.68 |
| Michigan | 8,844 | 9,909,877 | 0.89 |
| Minnesota | 2,775 | 5,457,173 | 0.51 |
| Mississippi | 201 | 2,994,079 | 0.07 |
| Missouri | 1,859 | 6,063,589 | 0.31 |
| Montana | 362 | 1,023,579 | 0.35 |
| Nebraska | 579 | 1,881,503 | 0.31 |
| Nevada | 1,509 | 2,839,099 | 0.53 |
| New Hampshire | 761 | 1,326,813 | 0.57 |
| New Jersey | 6,021 | 8,938,175 | 0.67 |
| New Mexico | 637 | 2,085,572 | 0.31 |
| New York | 11,278 | 19,746,227 | 0.57 |
| North Carolina | 3,384 | 9,943,964 | 0.34 |
| North Dakota | 91 | 739,482 | 0.12 |
| Ohio | 3,814 | 11,594,163 | 0.33 |
| Oklahoma | 806 | 3,878,051 | 0.21 |
| Oregon | 5,681 | 3,970,239 | 1.43 |
| Pennsylvania | 4,540 | 12,787,209 | 0.36 |
| Rhode Island | 417 | 1,055,173 | 0.40 |
| South Carolina | 1,056 | 4,832,482 | 0.22 |
| South Dakota | 160 | 853,175 | 0.19 |
| Tennessee | 2,730 | 6,549,352 | 0.42 |
| Texas | 9,925 | 26,956,958 | 0.37 |
| Utah | 1,565 | 2,942,902 | 0.53 |
| Vermont | 840 | 626,562 | 1.34 |
| Virginia | 3,628 | 8,326,289 | 0.44 |
| Washington | 12,291 | 7,061,530 | 1.74 |
| West Virginia | 271 | 1,850,326 | 0.15 |
| Wisconsin | 2,429 | 5,757,564 | 0.42 |
| Wyoming | 73 | 584,153 | 0.12 |
| All | 278,851 | 318,857,056 | 0.87 |
Sources: PEV registrations - National Renewable Energy Laboratory analysis, R.L. Polk, POLK_VIO_DETAIL_2014, May 2015. | |||


