Solar power is now more affordable in the United States than at any other point in history, and new analysis shows it has the potential to gain popularity in low- and moderate-income communities across the country.
Office of Critical Minerals and Energy Innovation
November 18, 2016


Solar power is now more affordable in the United States than at any other point in history. Reductions in the cost of photovoltaic (PV) systems, innovative financing options, and high consumer demand have led to unprecedented levels of solar deployment over the last five years.
Initially, the majority of solar installations were concentrated in a handful of states and located in neighborhoods of mostly upper- to middle-income households. However, 13 states installed more than 100 megawatts (MW) of solar last year alone and residential PV installations topped 2 gigawatts (GW). With continued decreases in the cost of solar and emerging business models that make financing more available, solar is becoming more affordable for everyone in every state.
In particular, community solar projects are gaining popularity, as they allow the almost half of U.S. households that may not have access to a “solar-ready” roof to take advantage of the sun’s energy and do it at a lower cost. This can make solar accessible to more low- and moderate-income (LMI) communities. Between 2010 and 2015, community solar installations grew rapidly, reaching almost 100 MW—and this business model has even greater potential. The National Renewable Energy Laboratory (NREL) estimates community solar could comprise up to half of the distributed PV market in 2020.
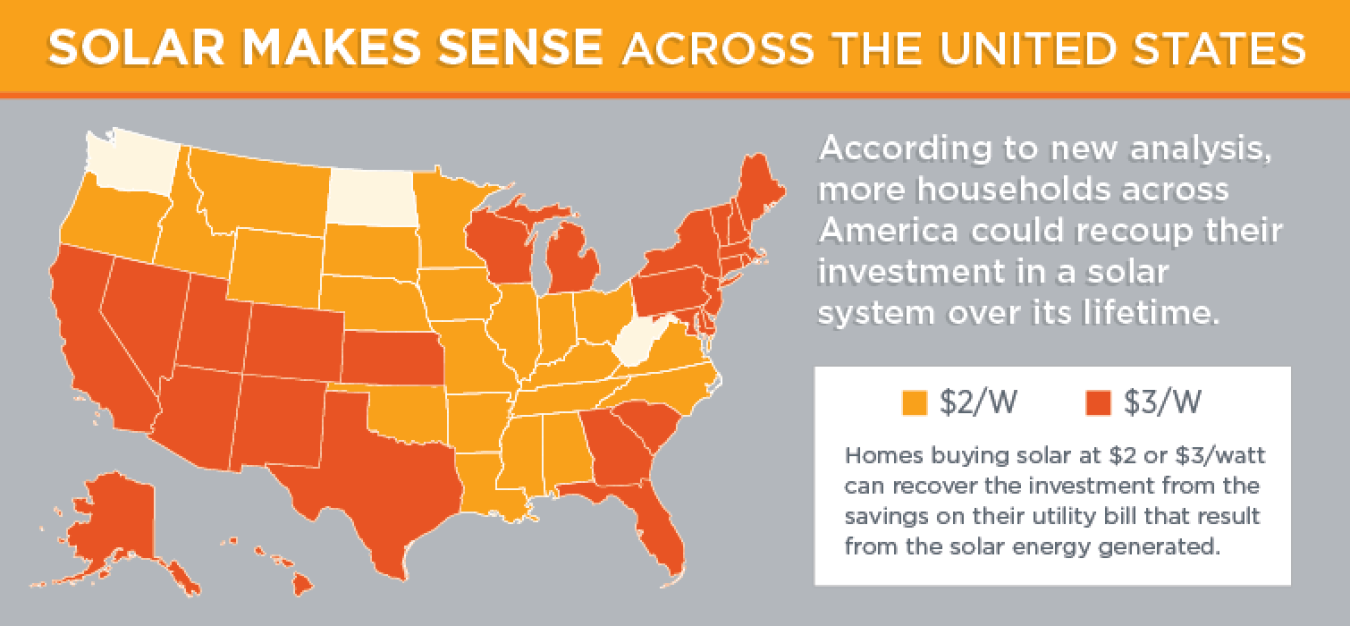
New solar data analysis from NREL explores the affordability of solar using a “savings to investment” (SIR) ratio. This metric captures the ability to recover one’s investment in solar based on the utility bill savings resulting from the solar energy generated by a given solar energy system. NREL conducted a simple SIR analysis for all 50 states by assuming that U.S. residential PV systems today cost between $3.00 per watt and $3.50 per watt and last 25 to 35 years. In this scenario, it could be cost-effective for households to make a shift to solar in a quarter to half of states without any state or local incentives.
Because community solar projects are often larger and can take advantage of bulk pricing, their installed costs are more in-line with commercial solar systems, which cost approximately $2.00 per watt to $2.50 per watt. Holding everything else constant, the number of states in the analysis with positive SIRs increases to 35-48 states with these lower installed costs, which means solar energy is potentially affordable in the vast majority of the country through the community solar business model.
Though this is a very basic analysis, it illustrates that solar is quickly becoming one of the most cost-effective sources of energy for all Americans, regardless of where they live. However, a recent report by the George Washington University Solar Institute shows that while 49.1 million households earn less than $40,000 of income per year and make up 40% of all U.S. households, they only account for less than 5% of solar installations. Providing the means for all communities to benefit from solar energy will help the U.S. meet its climate goals while also helping to create a fair market for solar that allows everyone, regardless of where they live or their financial status, to benefit from renewable energy.
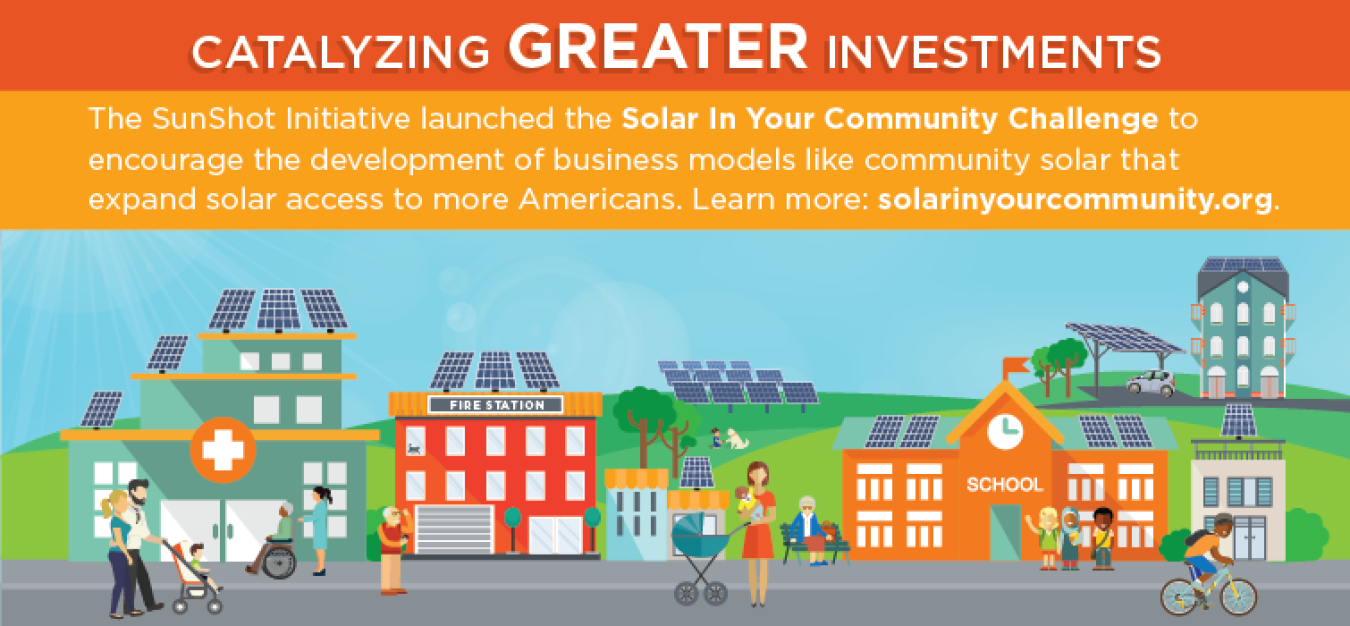
The enormous opportunity to expand solar electricity access to LMI households is why the SunShot Initiative launched the Solar in Your Community Challenge. Building on the recent White House announcement of the Clean Energy Savings for All Initiative, the Challenge will enable the expansion of the solar market to a diverse array of new consumers, especially LMI households and nonprofit, community-serving organizations. Given the analysis from NREL, we have high hopes that the Solar in Your Community Challenge will be the starting point for a solar revolution among new populations.
About the Analysis Methodology
An SIR score above 1 indicates that a household can recover the investment from the savings on their utility bill that result from the solar energy generated. The investment calculations for residential solar energy systems (approximately $3.00 per watt to $3.50 per watt) and larger solar energy systems that are deployed in community solar projects ($2.00 per watt to $2.50 per watt) are based on costs reported in both the NREL Benchmark Report and the Solar Market Insight report, operations and maintenance costs of $29 per kilowatt per year, and system lifetimes ranging from 25 to 35 years. It was also assumed that households would reap the benefits of the federal Investment Tax Credit of 30% through established financing or business models, such as third-party ownership or community solar models. The savings for a household also assume full net-metering credit for customers. Though a reference PV system was assumed in all cases, the savings calculations differed by state in terms of the electricity rates and changes in rates over time for each state as reported by the Energy Information Administration. Solar production in different regions of the U.S. was also captured in capacity factors for each state that were taken from an NREL model called the Regional Energy Deployment System. A 3% social discount rate was assumed to capture the time value of the savings over the lifetime of the system. Degradation of the PV system’s ability to produce electricity was assumed to be 0.75% per year. Though many other jurisdiction-specific nuances (e.g. state, local, or utility incentives or community solar credits) were not included in this simple analysis, the results begin to frame up an enormous opportunity to reduce the energy burden that households across the country face while also giving them access to renewable energy.
View the tool used by NREL to conduct this analysis.

