
Upcoming Peer Exchange Calls
New Resources
New DOE Health + Home Performance Infographic to Spark Homeowner Conversations
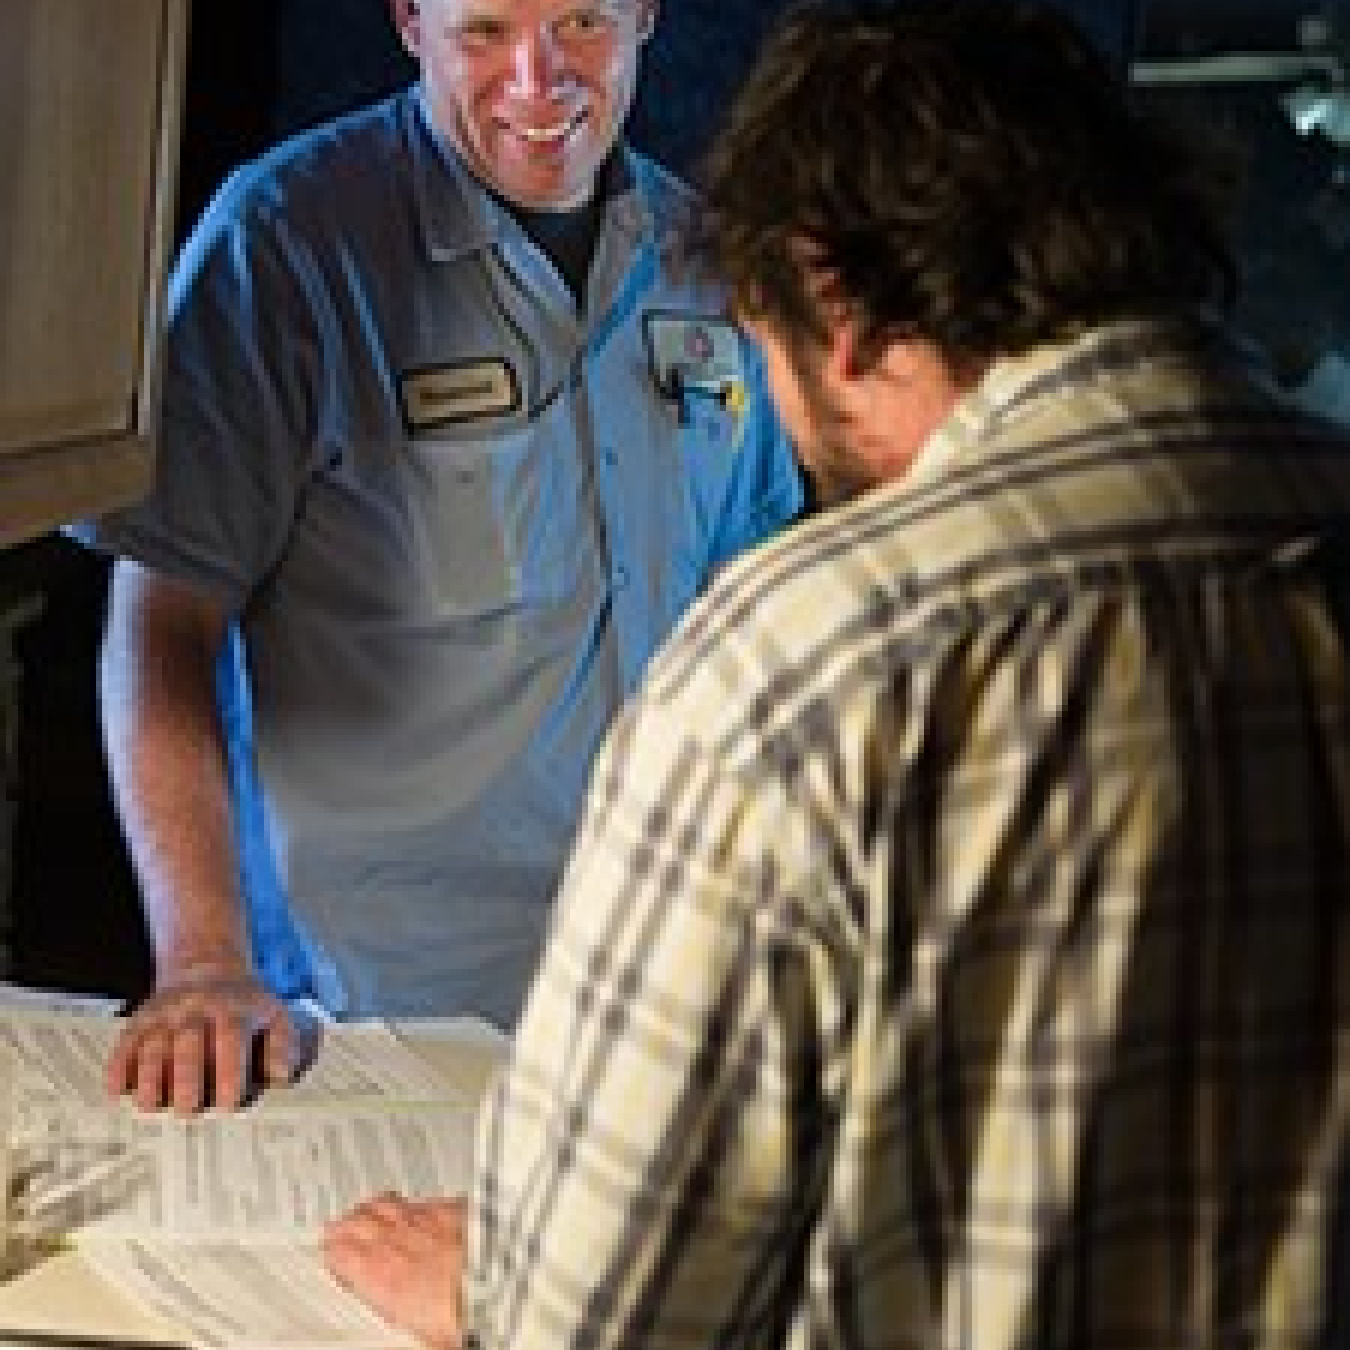
Find photos to help tell the upgrade story with these image libraries.
Read the latest fact sheet: Innovative Community Energy-Savings Success Stories.
Read the new Residential Energy Dispatch newsletter that covers all residential programs.
View more than 300 Peer Exchange Call Summaries.
Download Lessons Learned: Peer Exchange Calls.
Check out the Better Buildings Residential Program Solution Center.
View more resources from the Better Buildings Residential Network.
Residential Network Members
Explore the map of Residential Network members from across North America.


Stay Connected
Subscribe to the Residential Energy Dispatch newsletter.
Contact Us
Better Buildings Residential Network
Office of Energy Efficiency and Renewable Energy
U.S. Department of Energy
Washington, DC 20585
E-mail Us
bbresidentialnetwork@ee.doe.gov