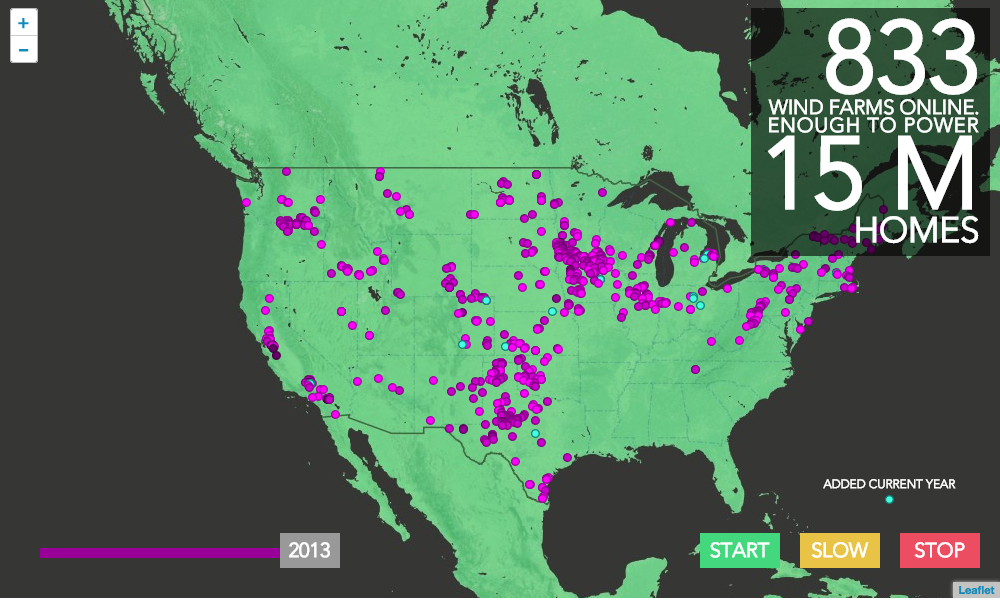
As we publish the 2012 Wind Technologies Market Report, we are excited to break down some recent EIA data not included in the report that shows significant wind farm growth across the nation. 2012 was a big year for wind energy. In total, 143 wind farms either came on line or added capacity in 2012, bringing the total number to 815. This brought the country’s total wind capacity to more than 60 GW, enough energy to power about 15 million homes.
We set out to chart the growth of wind farms over time. In the map, above, we plotted wind farm locations as they came on line since 1975. Through this, you can see the rapid and expansive spread of wind farms throughout much of the country since their introduction in California.
Delve into the map and check out some of its features. You can zoom and pan to areas you want to see up close (we suggest California, Texas and Iowa). Click play to see how fast wind power has grown in the last 35 years. You can click and drag the time slider to see any year you would like.
When a wind farm is first added to the map it flashes blue, so that you can see which points are from the year you are viewing. After that, they change to a shade of purple corresponding to their age. The darker the point on the map, the older the wind farm. You can use the colors on the time slider as a legend to decode what era each wind farm is from.
After you explore the map, read the full report at energy.gov/windreport.
