
SUBSCRIBE to the Fact of the Week
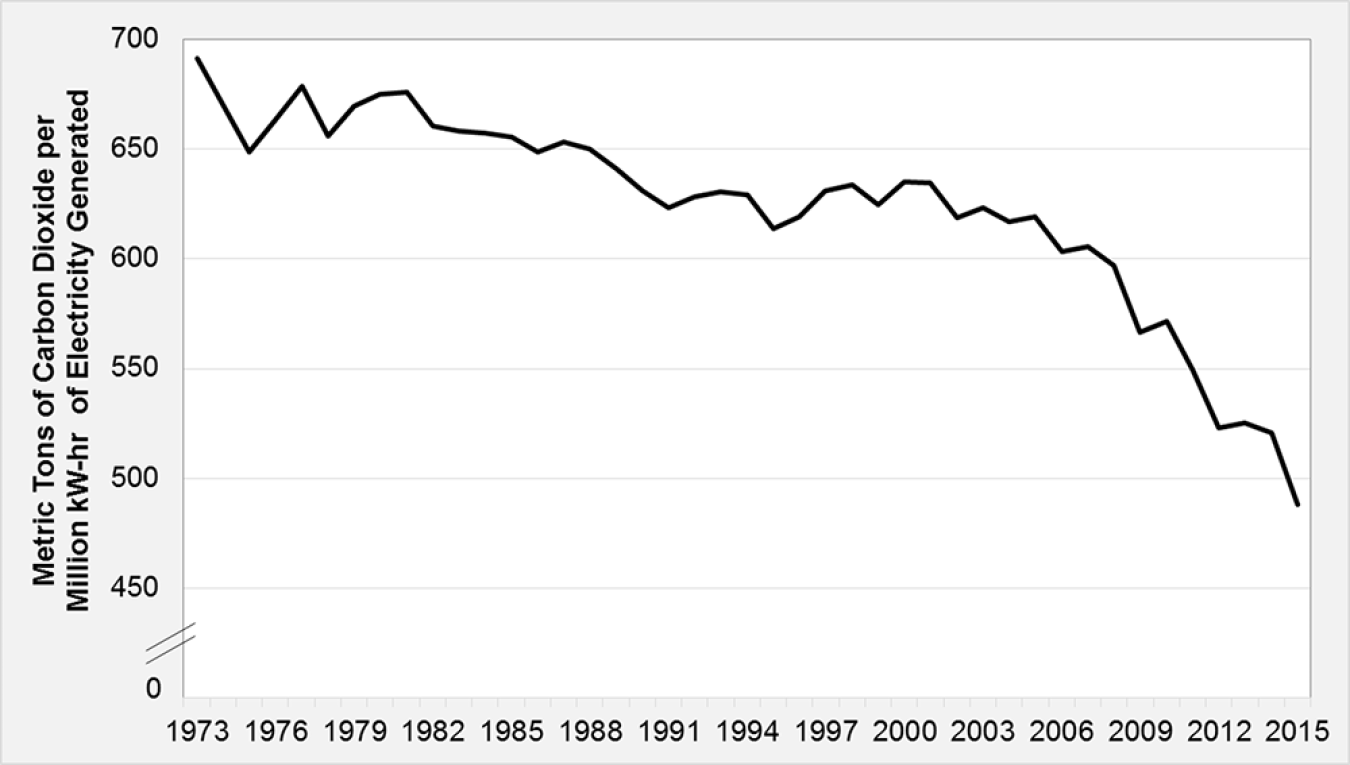
In 1973, the electric power sector produced 691 metric tons of carbon dioxide (CO2) emissions per million kilowatt hour (kW-hr) of electricity generated. By 2015, CO2 emissions were down to 488 metric tons per million kW-hr of electricity generated. That reduction is about 30% with much of it occurring in the last ten years. The declining use of coal and increasing reliance on less carbon intensive sources, including natural gas and renewables, has contributed to the decrease in CO2 emissions from electricity generation.
Since February of 2016, the transportation sector CO2 emissions have exceeded that of the electric power sector, partly due to the decrease in electric power sector emissions. As the transportation sector relies more upon the power grid for supporting the growing number of plug-in electric vehicles, the decrease in CO2 from power generation will benefit the transportation sector as well.
Carbon Dioxide Emissions per kW-hr of Electricity Generated in the Electric Power Sector, 1973-2015
Supporting Information
Carbon Dioxide Emissions per kW-hr of Electricity Generated in the Electric Power Sector, 1973-2015
| Year | Million Kilowatt-hours of Electricity Generated | Million Metric Tons of Carbon Dioxide Emissions | Metric Tons of Carbon Dioxide Emissions per Million kW-hr of Electricity Generated |
|---|---|---|---|
| 1973 | 1,860,710 | 1,286 | 691 |
| 1974 | 1,867,140 | 1,251 | 670 |
| 1975 | 1,917,649 | 1,244 | 649 |
| 1976 | 2,037,696 | 1,351 | 663 |
| 1977 | 2,124,323 | 1,442 | 679 |
| 1978 | 2,206,331 | 1,448 | 656 |
| 1979 | 2,247,372 | 1,505 | 670 |
| 1980 | 2,286,439 | 1,544 | 675 |
| 1981 | 2,294,812 | 1,551 | 676 |
| 1982 | 2,241,211 | 1,481 | 661 |
| 1983 | 2,310,285 | 1,521 | 658 |
| 1984 | 2,416,304 | 1,588 | 657 |
| 1985 | 2,469,841 | 1,619 | 656 |
| 1986 | 2,487,310 | 1,613 | 649 |
| 1987 | 2,572,127 | 1,680 | 653 |
| 1988 | 2,704,250 | 1,758 | 650 |
| 1989 | 2,848,227 | 1,826 | 641 |
| 1990 | 2,901,322 | 1,831 | 631 |
| 1991 | 2,935,561 | 1,830 | 623 |
| 1992 | 2,934,374 | 1,843 | 628 |
| 1993 | 3,043,897 | 1,919 | 630 |
| 1994 | 3,088,725 | 1,944 | 629 |
| 1995 | 3,194,230 | 1,960 | 614 |
| 1996 | 3,284,141 | 2,033 | 619 |
| 1997 | 3,329,375 | 2,101 | 631 |
| 1998 | 3,457,416 | 2,192 | 634 |
| 1999 | 3,529,982 | 2,204 | 624 |
| 2000 | 3,637,529 | 2,310 | 635 |
| 2001 | 3,580,053 | 2,273 | 635 |
| 2002 | 3,698,458 | 2,288 | 619 |
| 2003 | 3,721,159 | 2,319 | 623 |
| 2004 | 3,808,360 | 2,350 | 617 |
| 2005 | 3,902,192 | 2,416 | 619 |
| 2006 | 3,908,077 | 2,358 | 603 |
| 2007 | 4,005,343 | 2,425 | 605 |
| 2008 | 3,974,349 | 2,373 | 597 |
| 2009 | 3,809,837 | 2,158 | 566 |
| 2010 | 3,972,386 | 2,270 | 572 |
| 2011 | 3,948,186 | 2,170 | 550 |
| 2012 | 3,890,358 | 2,034 | 523 |
| 2013 | 3,903,715 | 2,050 | 525 |
| 2014 | 3,937,003 | 2,050 | 521 |
| 2015 | 3,930,579 | 1,919 | 488 |
Source: Energy Information Administration, August 2016 Monthly Energy Review, Tables 7.2b and 12.6. | |||