
SUBSCRIBE to the Fact of the Week
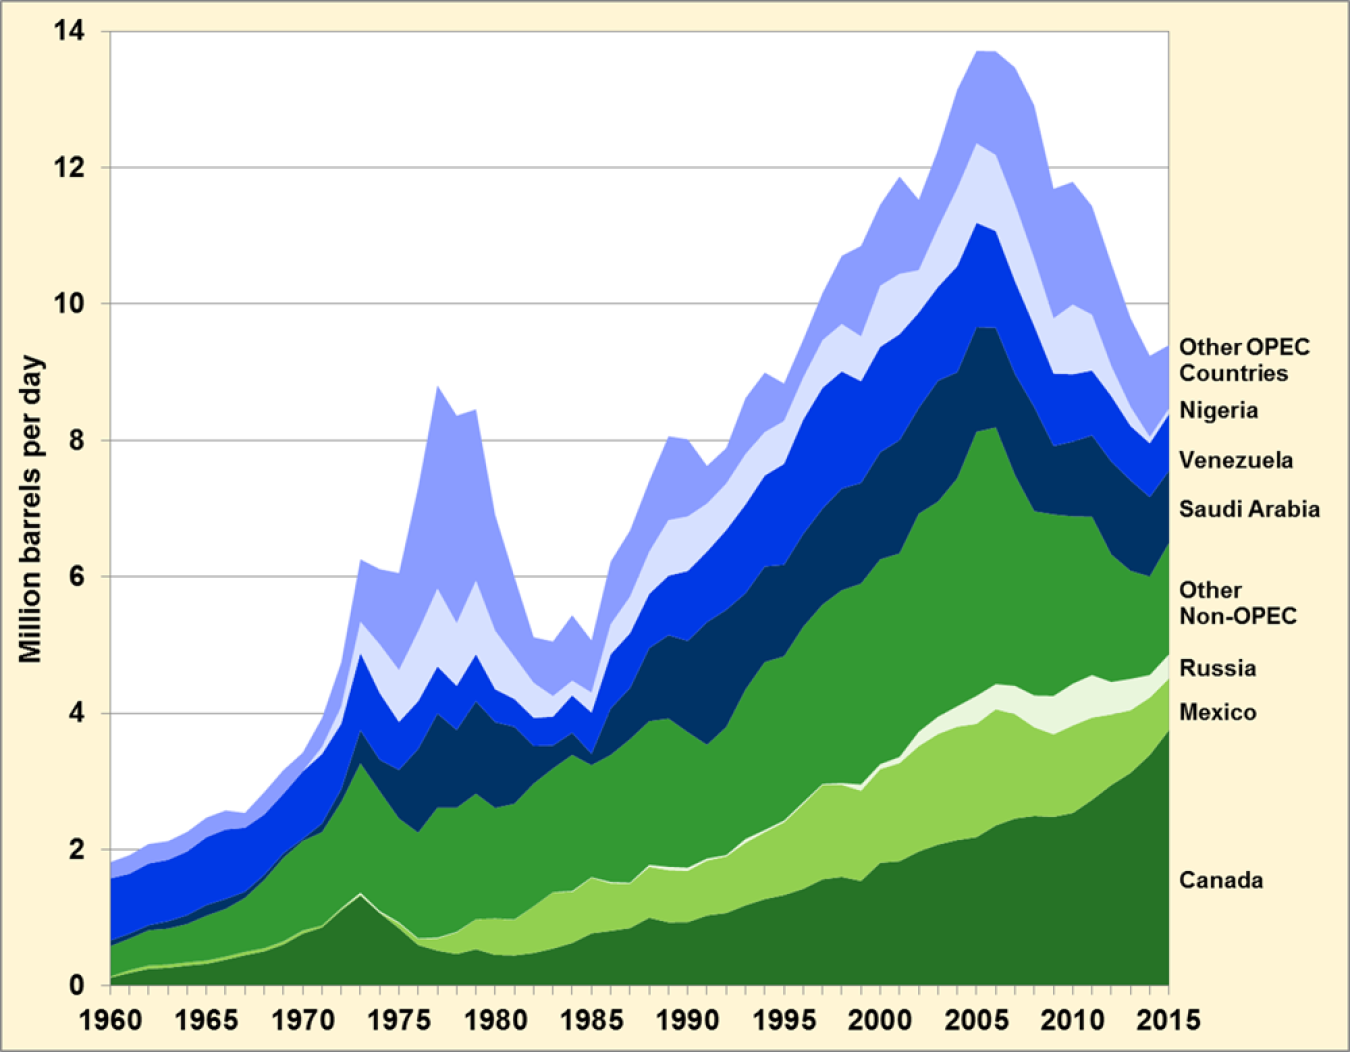
The figure below shows the volume and source of imported petroleum to the United States from 1960 to 2015. The countries which are members of OPEC (Organization of the Petroleum Exporting Countries) are shown in shades of blue while non-OPEC countries are shown in shades of green. Petroleum imports rose sharply from the mid-1960s to 1977 when OPEC countries supplied 70% of all imported petroleum. Petroleum imports then plummeted from the late 1970s through the early 1980s. While petroleum imports rebounded to a peak of nearly 14 million barrels per day in 2005, the share of imports from non-OPEC countries has grown and now accounts for a majority of imported petroleum. In 2015, OPEC countries supplied just 31% of all petroleum imported to the United States. In fact, Canada supplied more petroleum to the United States in 2015 than all of the OPEC countries combined. Between 2005 and 2015, overall petroleum imports have declined by 31.4%.
U.S. Petroleum Imports by Country, 1960-2015
Supporting Information
| Year | Canada | Mexico | Russia | Other Non-OPEC | Nigeria | Saudi Arabia | Venezuela | Other OPEC Countries | Total Imports | Percent OPEC |
|---|---|---|---|---|---|---|---|---|---|---|
| 1960 | 0.12 | 0.02 | - | 0.45 | - | 0.08 | 0.91 | 0.24 | 1.81 | 68% |
| 1961 | 0.19 | 0.04 | - | 0.46 | - | 0.07 | 0.88 | 0.27 | 1.92 | 64% |
| 1962 | 0.25 | 0.05 | - | 0.52 | - | 0.07 | 0.91 | 0.29 | 2.08 | 61% |
| 1963 | 0.27 | 0.05 | - | 0.53 | - | 0.11 | 0.90 | 0.27 | 2.12 | 60% |
| 1964 | 0.30 | 0.05 | - | 0.56 | - | 0.13 | 0.93 | 0.29 | 2.26 | 60% |
| 1965 | 0.32 | 0.05 | - | 0.66 | - | 0.16 | 0.99 | 0.29 | 2.47 | 58% |
| 1966 | 0.38 | 0.05 | - | 0.70 | - | 0.15 | 1.02 | 0.28 | 2.57 | 56% |
| 1967 | 0.45 | 0.05 | - | 0.79 | - | 0.09 | 0.94 | 0.22 | 2.54 | 49% |
| 1968 | 0.51 | 0.05 | - | 1.00 | - | 0.07 | 0.89 | 0.33 | 2.84 | 45% |
| 1969 | 0.61 | 0.04 | 0.00 | 1.23 | - | 0.07 | 0.87 | 0.35 | 3.17 | 41% |
| 1970 | 0.77 | 0.04 | 0.00 | 1.31 | - | 0.03 | 0.99 | 0.27 | 3.42 | 38% |
| 1971 | 0.86 | 0.03 | - | 1.37 | 0.10 | 0.13 | 1.02 | 0.42 | 3.93 | 43% |
| 1972 | 1.11 | 0.02 | 0.01 | 1.56 | 0.25 | 0.19 | 0.96 | 0.65 | 4.74 | 43% |
| 1973 | 1.32 | 0.02 | 0.03 | 1.90 | 0.46 | 0.49 | 1.13 | 0.91 | 6.26 | 48% |
| 1974 | 1.07 | 0.01 | 0.02 | 1.76 | 0.71 | 0.46 | 0.98 | 1.10 | 6.11 | 53% |
| 1975 | 0.85 | 0.07 | 0.01 | 1.52 | 0.76 | 0.71 | 0.70 | 1.42 | 6.06 | 59% |
| 1976 | 0.60 | 0.09 | 0.01 | 1.55 | 1.02 | 1.23 | 0.70 | 2.11 | 7.31 | 69% |
| 1977 | 0.52 | 0.18 | 0.01 | 1.91 | 1.14 | 1.38 | 0.69 | 2.98 | 8.81 | 70% |
| 1978 | 0.47 | 0.32 | 0.01 | 1.82 | 0.92 | 1.14 | 0.65 | 3.04 | 8.36 | 69% |
| 1979 | 0.54 | 0.44 | 0.00 | 1.84 | 1.08 | 1.36 | 0.69 | 2.51 | 8.46 | 67% |
| 1980 | 0.45 | 0.53 | 0.00 | 1.62 | 0.86 | 1.26 | 0.48 | 1.70 | 6.91 | 62% |
| 1981 | 0.45 | 0.52 | 0.00 | 1.70 | 0.62 | 1.13 | 0.41 | 1.17 | 6.00 | 55% |
| 1982 | 0.48 | 0.68 | 0.00 | 1.80 | 0.51 | 0.55 | 0.41 | 0.67 | 5.11 | 42% |
| 1983 | 0.55 | 0.83 | 0.00 | 1.81 | 0.30 | 0.34 | 0.42 | 0.80 | 5.05 | 37% |
| 1984 | 0.63 | 0.75 | 0.01 | 2.00 | 0.22 | 0.32 | 0.55 | 0.96 | 5.44 | 38% |
| 1985 | 0.77 | 0.82 | 0.01 | 1.64 | 0.29 | 0.17 | 0.60 | 0.76 | 5.07 | 36% |
| 1986 | 0.81 | 0.70 | 0.02 | 1.86 | 0.44 | 0.68 | 0.79 | 0.92 | 6.22 | 46% |
| 1987 | 0.85 | 0.65 | 0.01 | 2.10 | 0.53 | 0.75 | 0.80 | 0.97 | 6.68 | 46% |
| 1988 | 1.00 | 0.75 | 0.03 | 2.11 | 0.62 | 1.07 | 0.79 | 1.03 | 7.40 | 48% |
| 1989 | 0.93 | 0.77 | 0.05 | 2.17 | 0.82 | 1.22 | 0.87 | 1.23 | 8.06 | 51% |
| 1990 | 0.93 | 0.76 | 0.04 | 1.99 | 0.80 | 1.34 | 1.02 | 1.13 | 8.02 | 54% |
| 1991 | 1.03 | 0.81 | 0.03 | 1.67 | 0.70 | 1.80 | 1.03 | 0.55 | 7.63 | 54% |
| 1992 | 1.07 | 0.83 | 0.02 | 1.88 | 0.68 | 1.72 | 1.17 | 0.52 | 7.89 | 52% |
| 1993 | 1.18 | 0.92 | 0.05 | 2.19 | 0.74 | 1.41 | 1.30 | 0.82 | 8.62 | 50% |
| 1994 | 1.27 | 0.98 | 0.03 | 2.46 | 0.64 | 1.40 | 1.33 | 0.87 | 9.00 | 47% |
| 1995 | 1.33 | 1.07 | 0.02 | 2.41 | 0.63 | 1.34 | 1.48 | 0.55 | 8.83 | 45% |
| 1996 | 1.42 | 1.24 | 0.03 | 2.57 | 0.62 | 1.36 | 1.68 | 0.56 | 9.48 | 44% |
| 1997 | 1.56 | 1.39 | 0.01 | 2.63 | 0.70 | 1.41 | 1.77 | 0.69 | 10.16 | 45% |
| 1998 | 1.60 | 1.35 | 0.02 | 2.83 | 0.70 | 1.49 | 1.72 | 1.00 | 10.71 | 46% |
| 1999 | 1.54 | 1.32 | 0.09 | 2.95 | 0.66 | 1.48 | 1.49 | 1.33 | 10.85 | 46% |
| 2000 | 1.81 | 1.37 | 0.07 | 3.00 | 0.90 | 1.57 | 1.55 | 1.19 | 11.46 | 45% |
| 2001 | 1.83 | 1.44 | 0.09 | 2.98 | 0.89 | 1.66 | 1.55 | 1.43 | 11.87 | 47% |
| 2002 | 1.97 | 1.55 | 0.21 | 3.20 | 0.62 | 1.55 | 1.40 | 1.03 | 11.53 | 40% |
| 2003 | 2.07 | 1.62 | 0.25 | 3.15 | 0.87 | 1.77 | 1.38 | 1.14 | 12.26 | 42% |
| 2004 | 2.14 | 1.66 | 0.30 | 3.34 | 1.14 | 1.56 | 1.55 | 1.45 | 13.15 | 43% |
| 2005 | 2.18 | 1.66 | 0.41 | 3.87 | 1.17 | 1.54 | 1.53 | 1.36 | 13.71 | 41% |
| 2006 | 2.35 | 1.71 | 0.37 | 3.76 | 1.11 | 1.46 | 1.42 | 1.52 | 13.71 | 40% |
| 2007 | 2.45 | 1.53 | 0.41 | 3.09 | 1.13 | 1.48 | 1.36 | 2.00 | 13.47 | 44% |
| 2008 | 2.49 | 1.30 | 0.47 | 2.70 | 0.99 | 1.53 | 1.19 | 2.25 | 12.92 | 46% |
| 2009 | 2.48 | 1.21 | 0.56 | 2.66 | 0.81 | 1.00 | 1.06 | 1.90 | 11.69 | 41% |
| 2010 | 2.54 | 1.28 | 0.61 | 2.46 | 1.02 | 1.10 | 0.99 | 1.80 | 11.79 | 42% |
| 2011 | 2.73 | 1.21 | 0.62 | 2.32 | 0.82 | 1.19 | 0.95 | 1.59 | 11.44 | 40% |
| 2012 | 2.95 | 1.03 | 0.48 | 1.87 | 0.44 | 1.37 | 0.96 | 1.51 | 10.60 | 40% |
| 2013 | 3.13 | 0.92 | 0.46 | 1.58 | 0.28 | 1.33 | 0.80 | 1.30 | 9.79 | 38% |
| 2014 | 3.39 | 0.84 | 0.33 | 1.44 | 0.09 | 1.17 | 0.79 | 1.19 | 9.24 | 35% |
| 2015 | 3.75 | 0.76 | 0.35 | 1.64 | 0.08 | 1.06 | 0.83 | 0.93 | 9.40 | 31% |
Source: | ||||||||||