
SUBSCRIBE to the Fact of the Week
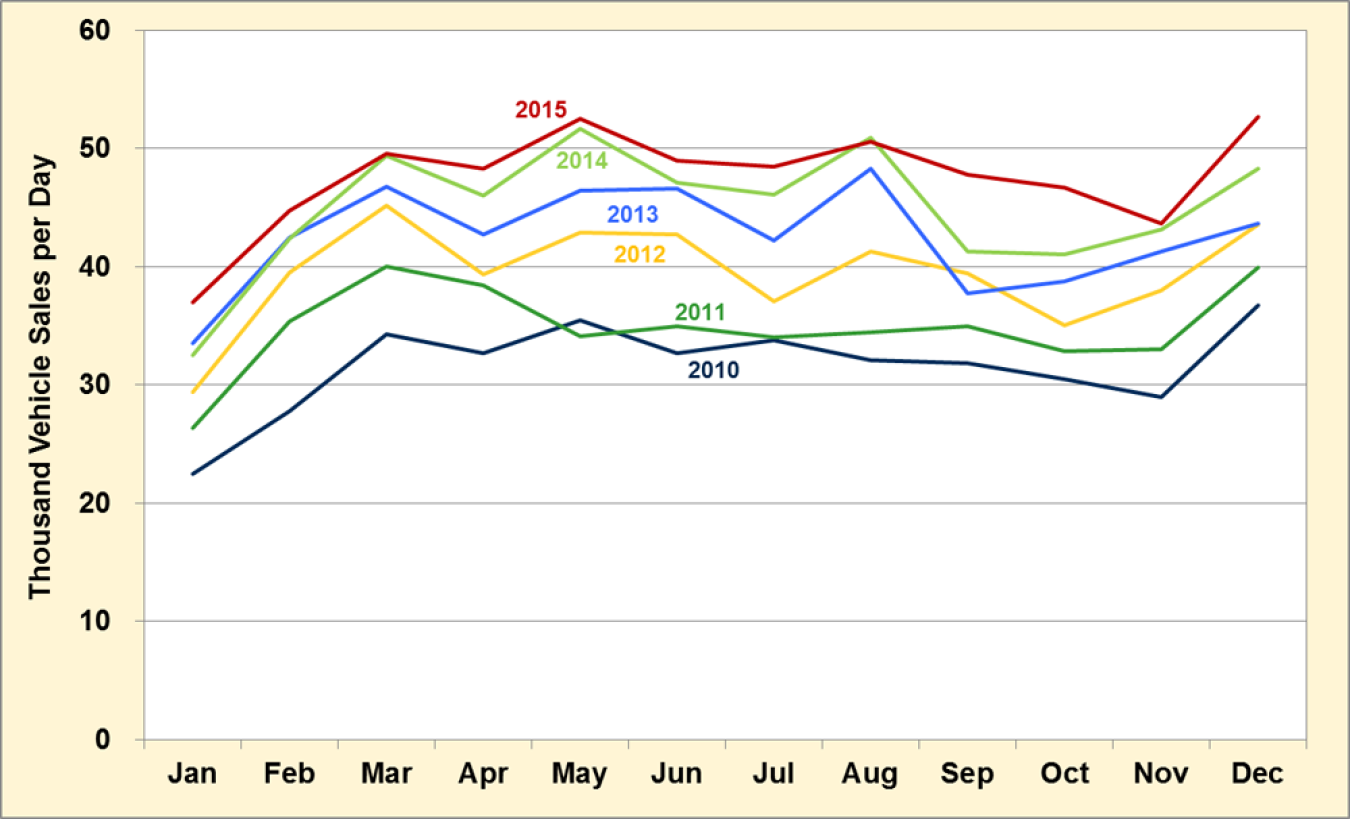
The sales of light vehicles are higher in 2015 than any of the past five years – a 50% growth from 2010. In fact, from 2010 to 2015, light vehicle sales have grown every year. The months with the highest sales per day are March, May, August, and December.
Light Vehicle Sales per Day, 2010-2015
| Calendar Year | 2010 | 2011 | 2012 | 2013 | 2014 | 2015 |
|---|---|---|---|---|---|---|
| Total Light Vehicle Sales (Millions) | 11.6 | 12.7 | 14.4 | 15.5 | 16.4 | 17.4 |
Supporting Information
| Month | 2010 | 2011 | 2012 | 2013 | 2014 | 2015 |
|---|---|---|---|---|---|---|
| Jan | 22.5 | 26.3 | 29.4 | 33.6 | 32.5 | 37.0 |
| Feb | 27.8 | 35.4 | 39.5 | 42.5 | 42.4 | 44.7 |
| Mar | 34.3 | 40.1 | 45.2 | 46.8 | 49.4 | 49.6 |
| Apr | 32.7 | 38.5 | 39.4 | 42.7 | 46.0 | 48.3 |
| May | 35.5 | 34.1 | 42.9 | 46.4 | 51.7 | 52.5 |
| Jun | 32.7 | 35.0 | 42.7 | 46.6 | 47.2 | 49.0 |
| Jul | 33.8 | 34.1 | 37.1 | 42.3 | 46.1 | 48.5 |
| Aug | 32.1 | 34.5 | 41.3 | 48.3 | 50.9 | 50.6 |
| Sep | 31.9 | 35.0 | 39.5 | 37.8 | 41.3 | 47.8 |
| Oct | 30.5 | 32.8 | 35.1 | 38.8 | 41.1 | 46.7 |
| Nov | 29.0 | 33.0 | 38.0 | 41.3 | 43.1 | 43.7 |
| Dec | 36.8 | 40.0 | 43.6 | 43.6 | 48.3 | 52.7 |
Source: Ward's Automotive | ||||||