
SUBSCRIBE to the Fact of the Week
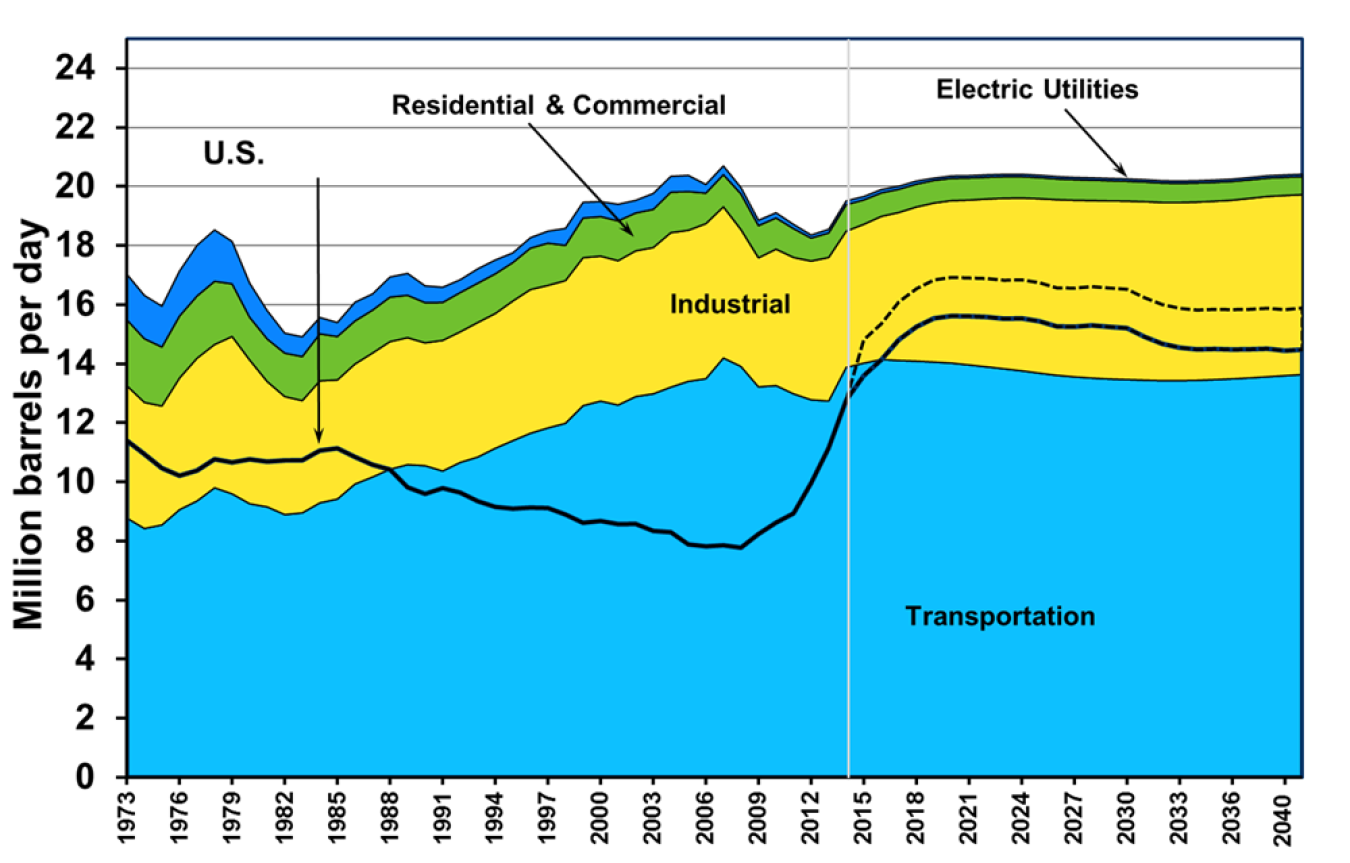
Before 1989 the U.S. produced enough petroleum to meet the needs of the transportation sector, but was still short of meeting the petroleum needs of all sectors, including industrial, residential and commercial, and electric utilities. In 1973 the gap between what the U.S. produced and what was consumed was 5.6 million barrels per day. Due to 1) increased petroleum production and 2) increased efficiencies across several sectors limiting demand, the gap is expected to be only about 4.5 million barrels per day by 2040 if petroleum and non-petroleum sources (ethanol, biomass, etc.) are included.
U.S. Petroleum Production and Consumption by Sector, 1973-2040
Notes:
The U.S. production has two lines after 2014. The solid line is conventional sources of petroleum, including crude oil, natural gas plant liquids, and refinery gains. The dashed line adds in other non-petroleum sources, including ethanol, biomass, liquids from coal, other blending components, other hydrocarbons, and ethers.
The data change from historical to projected values between 2013 and 2014 is denoted by a gray vertical line.
The sharp increase in transportation values between 2006 and 2007 is the result of the FHWA’s methodology change for heavy trucks.
Supporting Information
| Year | Transportation | Industrial | Residential and Commercial | Electric Utilities | Total | U.S Production without other inputs | U.S. Production with other inputs (dotted line 2015-on) |
|---|---|---|---|---|---|---|---|
| 1973 | 8.78 | 4.48 | 2.23 | 1.54 | 17.03 | 11.40 | |
| 1974 | 8.43 | 4.27 | 2.16 | 1.47 | 16.31 | 10.94 | |
| 1975 | 8.55 | 4.02 | 2.00 | 1.38 | 15.95 | 10.47 | |
| 1976 | 9.06 | 4.45 | 2.10 | 1.52 | 17.14 | 10.21 | |
| 1977 | 9.36 | 4.83 | 2.11 | 1.71 | 18.01 | 10.39 | |
| 1978 | 9.80 | 4.85 | 2.14 | 1.74 | 18.53 | 10.77 | |
| 1979 | 9.60 | 5.33 | 1.78 | 1.43 | 18.14 | 10.66 | |
| 1980 | 9.26 | 4.87 | 1.44 | 1.16 | 16.73 | 10.77 | |
| 1981 | 9.16 | 4.24 | 1.44 | 0.96 | 15.80 | 10.69 | |
| 1982 | 8.90 | 3.99 | 1.47 | 0.68 | 15.03 | 10.73 | |
| 1983 | 8.95 | 3.80 | 1.49 | 0.67 | 14.91 | 10.73 | |
| 1984 | 9.29 | 4.13 | 1.59 | 0.55 | 15.57 | 11.06 | |
| 1985 | 9.42 | 4.03 | 1.47 | 0.47 | 15.40 | 11.14 | |
| 1986 | 9.93 | 4.06 | 1.46 | 0.63 | 16.08 | 10.85 | |
| 1987 | 10.17 | 4.20 | 1.45 | 0.55 | 16.36 | 10.58 | |
| 1988 | 10.43 | 4.32 | 1.51 | 0.68 | 16.94 | 10.42 | |
| 1989 | 10.59 | 4.30 | 1.43 | 0.74 | 17.06 | 9.82 | |
| 1990 | 10.55 | 4.16 | 1.36 | 0.57 | 16.64 | 9.60 | |
| 1991 | 10.37 | 4.42 | 1.28 | 0.51 | 16.59 | 9.79 | |
| 1992 | 10.66 | 4.42 | 1.33 | 0.43 | 16.84 | 9.64 | |
| 1993 | 10.84 | 4.55 | 1.33 | 0.49 | 17.21 | 9.35 | |
| 1994 | 11.14 | 4.56 | 1.34 | 0.47 | 17.51 | 9.16 | |
| 1995 | 11.40 | 4.73 | 1.30 | 0.33 | 17.75 | 9.10 | |
| 1996 | 11.65 | 4.86 | 1.40 | 0.35 | 18.27 | 9.13 | |
| 1997 | 11.83 | 4.83 | 1.43 | 0.41 | 18.49 | 9.12 | |
| 1998 | 11.99 | 4.83 | 1.19 | 0.57 | 18.58 | 8.90 | |
| 1999 | 12.58 | 5.01 | 1.34 | 0.53 | 19.46 | 8.62 | |
| 2000 | 12.74 | 4.91 | 1.34 | 0.51 | 19.49 | 8.68 | |
| 2001 | 12.60 | 4.89 | 1.35 | 0.56 | 19.40 | 8.57 | |
| 2002 | 12.89 | 4.93 | 1.28 | 0.43 | 19.53 | 8.58 | |
| 2003 | 12.98 | 4.95 | 1.29 | 0.54 | 19.76 | 8.34 | |
| 2004 | 13.21 | 5.23 | 1.37 | 0.54 | 20.34 | 8.30 | |
| 2005 | 13.40 | 5.11 | 1.31 | 0.55 | 20.37 | 7.89 | |
| 2006 | 13.49 | 5.25 | 1.03 | 0.29 | 20.07 | 7.82 | |
| 2007 | 14.20 | 5.12 | 1.09 | 0.30 | 20.70 | 7.86 | |
| 2008 | 13.91 | 4.63 | 1.21 | 0.21 | 19.96 | 7.78 | |
| 2009 | 13.22 | 4.37 | 1.09 | 0.18 | 18.85 | 8.24 | |
| 2010 | 13.26 | 4.62 | 1.06 | 0.18 | 19.11 | 8.62 | |
| 2011 | 12.98 | 4.62 | 0.98 | 0.14 | 18.71 | 8.94 | |
| 2012 | 12.78 | 4.70 | 0.78 | 0.10 | 18.36 | 9.96 | |
| 2013 | 12.74 | 4.86 | 0.83 | 0.12 | 18.55 | 11.15 | |
| 2014 | 13.88 | 4.610 | 0.90 | 0.128 | 19.51 | 12.77 | |
| 2015 | 14.02 | 4.699 | 0.83 | 0.114 | 19.66 | 13.60 | 14.81 |
| 2016 | 14.14 | 4.845 | 0.79 | 0.112 | 19.89 | 14.14 | 15.35 |
| 2017 | 14.11 | 5.010 | 0.78 | 0.101 | 20.01 | 14.81 | 16.09 |
| 2018 | 14.09 | 5.218 | 0.77 | 0.102 | 20.18 | 15.25 | 16.54 |
| 2019 | 14.06 | 5.381 | 0.76 | 0.078 | 20.28 | 15.54 | 16.84 |
| 2020 | 14.02 | 5.501 | 0.76 | 0.078 | 20.36 | 15.62 | 16.92 |
| 2021 | 13.96 | 5.580 | 0.75 | 0.078 | 20.36 | 15.61 | 16.90 |
| 2022 | 13.90 | 5.679 | 0.74 | 0.079 | 20.39 | 15.58 | 16.89 |
| 2023 | 13.83 | 5.774 | 0.73 | 0.079 | 20.41 | 15.52 | 16.82 |
| 2024 | 13.76 | 5.850 | 0.72 | 0.080 | 20.41 | 15.54 | 16.84 |
| 2025 | 13.68 | 5.905 | 0.71 | 0.079 | 20.38 | 15.44 | 16.74 |
| 2026 | 13.61 | 5.943 | 0.70 | 0.078 | 20.34 | 15.26 | 16.57 |
| 2027 | 13.56 | 5.976 | 0.70 | 0.078 | 20.31 | 15.25 | 16.56 |
| 2028 | 13.52 | 6.010 | 0.69 | 0.077 | 20.29 | 15.30 | 16.61 |
| 2029 | 13.49 | 6.028 | 0.68 | 0.078 | 20.27 | 15.25 | 16.56 |
| 2030 | 13.46 | 6.040 | 0.67 | 0.078 | 20.26 | 15.21 | 16.52 |
| 2031 | 13.45 | 6.041 | 0.67 | 0.077 | 20.23 | 14.91 | 16.24 |
| 2032 | 13.43 | 6.031 | 0.66 | 0.077 | 20.19 | 14.68 | 16.01 |
| 2033 | 13.43 | 6.030 | 0.65 | 0.077 | 20.19 | 14.55 | 15.88 |
| 2034 | 13.44 | 6.034 | 0.64 | 0.077 | 20.20 | 14.49 | 15.82 |
| 2035 | 13.46 | 6.039 | 0.64 | 0.077 | 20.22 | 14.50 | 15.84 |
| 2036 | 13.49 | 6.046 | 0.63 | 0.078 | 20.25 | 14.48 | 15.84 |
| 2037 | 13.52 | 6.076 | 0.63 | 0.078 | 20.30 | 14.49 | 15.84 |
| 2038 | 13.56 | 6.102 | 0.62 | 0.079 | 20.36 | 14.51 | 15.88 |
| 2039 | 13.60 | 6.098 | 0.62 | 0.079 | 20.39 | 14.44 | 15.83 |
| 2040 | 13.64 | 6.088 | 0.61 | 0.079 | 20.41 | 14.48 | 15.89 |
Source: Oak Ridge National Laboratory, Transportation Energy Data Book: Edition 34, Figure 1.7, September 2015. Projections are from the Energy Information Administration, Annual Energy Outlook 2015, April 2015. | |||||||